Notice: Undefined index: HTTP_ACCEPT_LANGUAGE in /home/noritsu/www/wp/wp-content/themes/noritsukoki/functions.php on line 328
Responding to Climate Change - Noritsu Koki

ENVIRONMENT

BASIC APPROACH

The Noritsu Koki Group considers climate change one of the social issues it must address as part of its material issues and will work to avoid or reduce the impact of climate change on the Group throughout its entire value chain. To this end, we wii promoting initiatives to contribute to the mitigation of and adaptation to climate change across the entire Group.

INITIATIVES

TARGETS AND PROGRESS

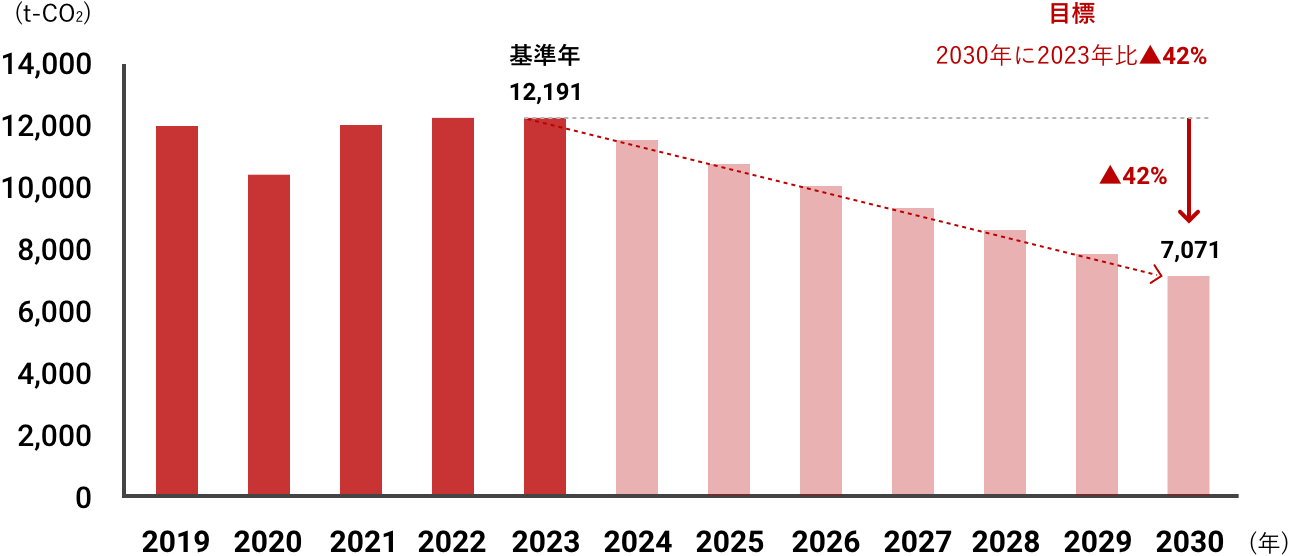
To measure and manage the potential business impact of climate change, using Scope 1 and 2* GHG emissions as our metrics, we have set a target of a 42% reduction by 2030 compared with 2023 (target revised in Sep. 2024). We have reviewed our target to make it aligned with the Science Based Targets initiative’s 1.5℃ scenario.

Target

Scope 1 and 2 Total Emissions

Performance

Emission Trends by Scope 1 and 2
Unit:t-CO2
2019 2020 2021 2022 2023
Scope1 1,876 1,753 2,253 2,334 1,897
Scope2 10,046 8,573 9,767 9,874 10,294
Total 11,923 10,325 12,020 12,208 12,191
Scope 1 and 2 Emissions by Operating Segment (2023)
Emissions(t-CO2 Percentage
Parts/
Materials
12,076 99.1%
Audio
Equipment/
Peripherals
83 0.7%
Others 32 0.3%
Total 12,191 -

Please visit here for the Reporting Criteria for 2023 GHG Emission (Scope 1 and 2) in the Integrated Report 2024

  • *Emissions for years up to and including 2022 have been restated due to a revision of emission factors and inclusion of gasoline usage in the calculation.
  • *Emissions for 2023 have been restated due to a revision of emission factors and inclusion of energy-related CH4, N2O and other non-energy-related GHGs in the calculation.
  • *The Scope 1 and 2 GHG emissions for 2023 disclosed in the Integrated Report 2024 have been assured by the third party organization.Please refer to page 35, 57 and 58 of the Integrated Report 2024.
  • *Scope 1: Direct emissions from a company’s business (fuel consumption, industrial processes, etc.)
    Scope 2: Indirect energy-related emissions from electric power and other energy consumed by a company

IMPLEMENTING SCOPE 1 AND 2 REDUCTION PLAN

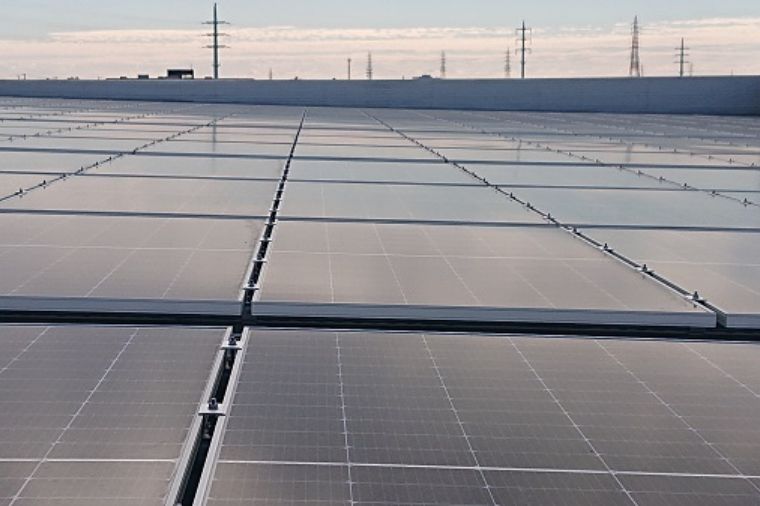
At Teibow, which has its own manufacturing sites, solar power generation equipment was installed at two of its domestic sites. In addition, the company focuses on reducing energy usage by introducing energy-saving equipment, streamlining production processes and promoting technological innovation. At AlphaTheta, the company continues to use 100% green electricity at the building that houses its head office.

CALCULATING SCOPE3 EMISSIONS

In 2023 we have started calculating Scope 3* emissions. We will continue considering ways to reduce GHG emissions throughout our entire supply chain.

  • *Scope 3: Indirect emissions other than Scope 1 and 2 (emissions by others in the upstream and downstream of a company’s activities)

Scope 3 Emissions (2023)

Category Emissions(t-CO2) Percentage Calculation Summary
01
Purchased goods and services
178,094 60.2% Emissions associated with raw materials, parts, and purchased products/services
02
Capital goods
6,175 2.1% Emissions generated by the capital investment
03
Fuel-and energy-related activities not included in Scope1 and 2
2,045 0.7% Emissions associated with energy procurement
04
Upstream transportation and distribution
9,473 3.2% Emissions associated with transportation of raw materials and products (including outbound logistics owned by the Group )
05
Waste generated in operation
546 0.2% Emissions associated with waste from business activities
06
Business travel
150 0.1% Emissions associated with employees’ business travel
07
Employee commuting
220 0.1% Emissions associated with employees’ commuting
08
Upstream leased assets
- - Not applicable
09
Downstream transportation and distribution
1,723 0.6% Emissions associated with transportation of raw materials and products
10
Processing of sold products
- - Not applicable
11
Use of sold products
96,581 32.7% Emissions associated with expected electricity consumption by products sold
12
End-of-life treatment of sold products
731 0.2% Emissions associated with expected disposal of products sold
13
Downstream leased assets
- - Not applicable
14
Franchises
- - Not applicable
15
Investments
- - Not applicable
Total 295,740

DISCLOSURE BASED ON THE TCFD RECOMMENDATIONS

The Noritsu Koki Group expressed its support for the Task Force on Climate-related Financial Disclosures (TCFD) recommendations in October 2022. Guided by the recommendations, we will identify the potential business implications of climate-related risks and opportunities and reflect them in our business strategy. We are committed to information disclosure and ensuring the realization of a sustainable society as well as the Group’s sustainable growth.

GOVERNANCE : ROLE OF THE BOARD OF DIRECTORS AND MONITORING SYSTEM

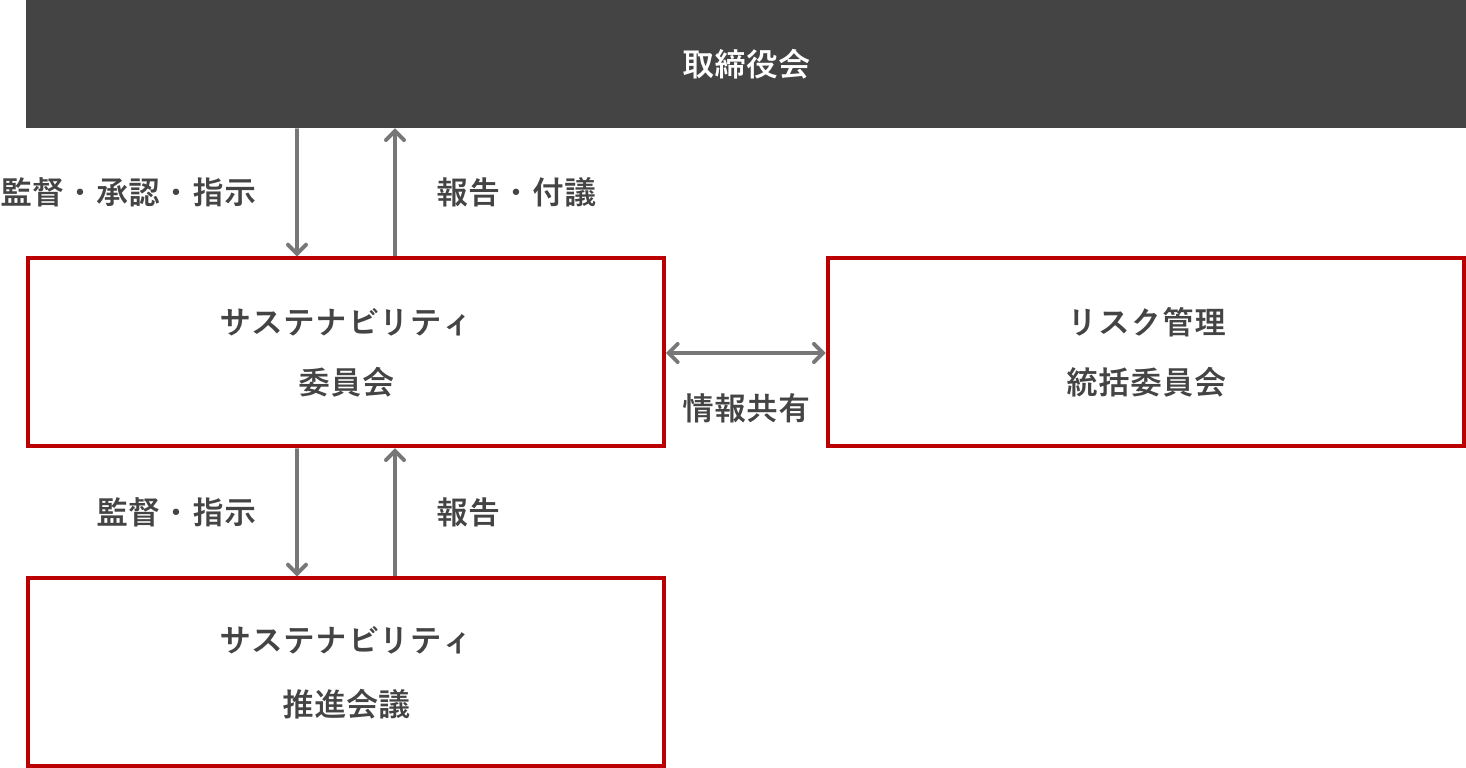
The Group’s Sustainability Promotion Committee, chaired by the representative director and CEO of Noritsu Koki, deliberates at least once a year on important sustainability issues including climate change responses. It also provides reports and recommendations to the Board at least four times a year, thereby ensuring an appropriate monitoring system. The Board deliberates and makes decisions on important climate-related risks and opportunities, and also provides direction and oversees progress.

Prior to the deliberations of the Sustainability Promotion Committee, important sustainability issues are first thoroughly discussed in Sustainability Promotion Meetings chaired by an executive officer. In the meetings, members share the results of initiatives to address climate change through business activities and efforts to reduce GHG emissions throughout the Group.

RISK MANAGEMENT : RISK ASSESSMENT, IDENTIFICATION AND MANAGEMENT PROCESS

The Sustainability Promotion Committee assesses, analyzes and identifies climate-related risks and opportunities that may significantly impact the Group and its business. The committee develops policies and measures to mitigate these risks and take advantage of opportunities. It also presents reports and recommendations to the Board of Directors. The Board oversees the effectiveness of the risk management process and overall progress.

The Risk Management Committee manages overall risks across the entire Group. It shares information on climate change-related risks with the Sustainability Promotion Committee and considers further action as appropriate.

Responsible Parties Purpose
Board of Directors
  • Discussing and making decisions on important climate-related risks and opportunities
  • Providing direction and overseeing progress
  • Overseeing the effectiveness of the Sustainability Promotion Committee’s risk management process and overall progress
Sustainability Promotion Committee
  • Assessing and analyzing climate-related risks and opportunities. Identifying important climate-related risks and opportunities. Developing policies and measures to mitigate these risks and take advantage of opportunities.
  • Presenting reports and recommendations to the Board of Directors
Risk Management Committee
  • Sharing information about these climate-related risks. Considering further action as appropriate.
Sustainability Promotion Meetings
  • Discussing climate-related risks and opportunities
  • Sharing the results of Group-wide climate change responses and tracking efforts to reduce GHG emissions throughout the Group

STRATEGY : SCENARIO ANALYSES

To strengthen the Group’s resilience, respond to risks and opportunities that may impact business and develop new strategies, we performed scenario analyses. We used the 1.5℃–2℃ scenario and the 4℃ scenario as presented by organizations such as the Intergovernmental Panel on Climate Change (IPCC) and the International Energy Agency (IEA). In the scenario analyses we identified two types of risks: transition risks, which are related to tightening of policies and regulations with the transition to a decarbonized society, and physical risks, which are associated with the increasing severity of abnormal weather events and a rise in average temperatures. Based on quantitative analyses, we assessed the possible financial impact by 2030.

Noritsu Koki recognizes the potential for climate change issues to have a significant impact on the Group’s businesses, strategies and financial plans. We therefore regularly assess risks and opportunities and revise our strategies.

Adopted
Scenarios
1.5℃scenario
  • IEA NZE(Net Zero Emissions by 2050)
2℃scenario
  • IPCC Rcp2.6
4℃scenario
  • IEA STEPS(Stated Policy Scenario)
  • IPCC SSP5-8.5

OUR RESPONSES TO CLIMATE-RELATED RISKS AND OPPORTUNITIES

Timeframe: Up to 2030
Financial impact assessment indicators: Small (less than ¥500 million) / Medium (from ¥500 million to less than ¥3 billion) / Large (¥3 billion or more)

Risk type Scenario Financial
Impact
Group Response
TRANSITIONRISK Policies and regulations Risk
  • Increase in costs related to GHG emissions in the Group’s manufacturing and business activities due to introduction of a carbon tax and emissions trading
Small
  • Medium- to long-term reduction in GHG emissions (increase rate of renewable energy usage, introduce energy-saving equipment, implement energy-saving measures, streamline production process, promote technology innovation, etc.)
  • Promotion of emissions reduction in cooperation with suppliers
Risk
  • Increase in electricity costs due to accelerated shift to renewable energy and resulting higher use of such energy
  • Increase in purchasing costs for procured products due to reflection of higher electricity costs
Small
Risk
  • Increase in investment costs resulting from requests to convert to highly energy efficient equipment driven by measures to promote energy saving
Small
Technology Risk
  • Increase in transportation expenses as higher costs are passed through to prices with the progressive introduction of low-carbon technologies by logistics companies
Medium
  • Promotion of modal shift, giving consideration to profitability
Market Risk
  • Decline in business opportunities if environmental initiatives become necessary throughout the supply chain due to the promotion of ethical consumption, and if our efforts are seen as not proactive enough
Medium
  • Supply of environmentally responsible products (reduction in resources used for products and packaging, shift to energysaving products with longer lifespans, use of reusable and recyclable materials, creation of product recycling systems, etc.)
  • Promotion of environmental initiatives in cooperation with suppliers
Opportunity
  • Increase in business opportunities if environmental initiatives become necessary throughout the supply chain due to the promotion of ethical consumption, and if our efforts are seen as proactive
Medium
Reputation Opportunity
  • Increase in stock price and decline in capital procurement costs as investor trust rises due to positive evaluation of our environmental consideration and BCP initiatives
Small
  • Enhancement of climate change initiatives and disclosure, as well as dialogue
PHYSICALRISK Acute Risk
  • Increase in costs incurred for responding to suspension of operations and logistics functions due to major impact on production sites and supply chains as increasingly severe abnormal weather causes an increase in flooding and storm surge damage at sites
Small*
  • Development of a business continuity plan (BCP) that includes the supply chain
  • Diversify suppliers
  • Relocation and decentralization of warehouses
  • Stronger flood measures
Chronic Risk
  • Increase in refrigeration costs due to chronic temperature rise
Small
  • Utilizing more energy-efficient air conditioning facilities
  • *For acute physical risks, we assessed domestic Group sites using hazard maps, flood control economic survey manuals and other tools. Under the 4°C scenario, one site would be at risk for business suspension and asset losses due to disasters. Given the recurrence period, however, the annual impact is low. We have therefore classified the impact as “small.” Going forward, we will continue to evaluate the impact, including at contract manufacturer sites.

METRICS AND TARGETS

To measure and manage the potential business impact of climate change, using Scope 1 and 2* GHG emissions as our metrics, we have set a target of a 42% reduction by 2030 compared with 2023 (target revised in Sep. 2024). We have reviewed our target to make it aligned with the Science Based Targets initiative’s 1.5℃ scenario. In addition, in 2023 we have started calculating Scope 3* emissions (disclosed in CDP Response 2024) . We will continue considering ways to reduce GHG emissions throughout our entire supply chain.

Performance

1 and 2 Total Emissions
Unit:t-CO2
Results Targets
2019 2020 2021 2022 2023 2030
Scope1・2 11,923 10,325 12,020 12,208 12,191 7,071

Please visit here for the Reporting Criteria for 2023 GHG Emission (Scope 1 and 2) in the Integrated Report 2024

  • *Emissions for years up to and including 2022 have been restated due to a revision of emission factors and inclusion of gasoline usage in the calculation.
  • *Emissions for 2023 have been restated due to a revision of emission factors and inclusion of energy-related CH4, N2O and other non-energy-related GHGs in the calculation.
  • *The Scope 1 and 2 GHG emissions for 2023 disclosed in the Integrated Report 2024 have been assured by the third party organization.Please refer to page 35, 57 and 58 of the Integrated Report 2024.
  • *Scope 1: Direct emissions from a company’s business (fuel consumption, industrial processes, etc.)
    Scope 2: Indirect energy-related emissions from electric power and other energy consumed by a company
    Scope 3: Indirect emissions other than Scope 1 and 2 (emissions by others in the upstream and downstream of a company’s activities)